![]()
Problems and explorations with graphing functions and relations
by
Hyeshin Choi
5. Examine graphs of y = a sin(bx + c) for different values of a, b, and c.
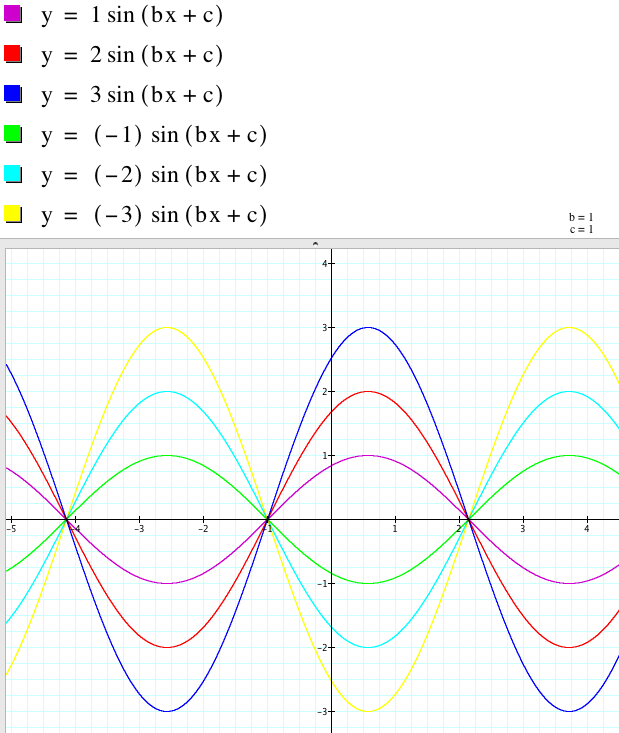
First I changed the value of a with from -3 to 3 and at the end I linked it to animation. Each time for the positive a is getting bigger and bigger, the altitude is larger and larger.For the negative value, the graphs are flipped upside down by x-axis. Amplitude is the magnitude of change in the oscillating variable, with each oscillation, within an oscillating system. For instance, sound waves are oscillations in atmospheric pressure and their amplitudes are proportional to the change in pressure during one oscillation. If a graph of the system is drawn with the oscillating variable as the vertical axis and time as the horizontal axis then the amplitude may be measured as the vertical distance between points on the curve.
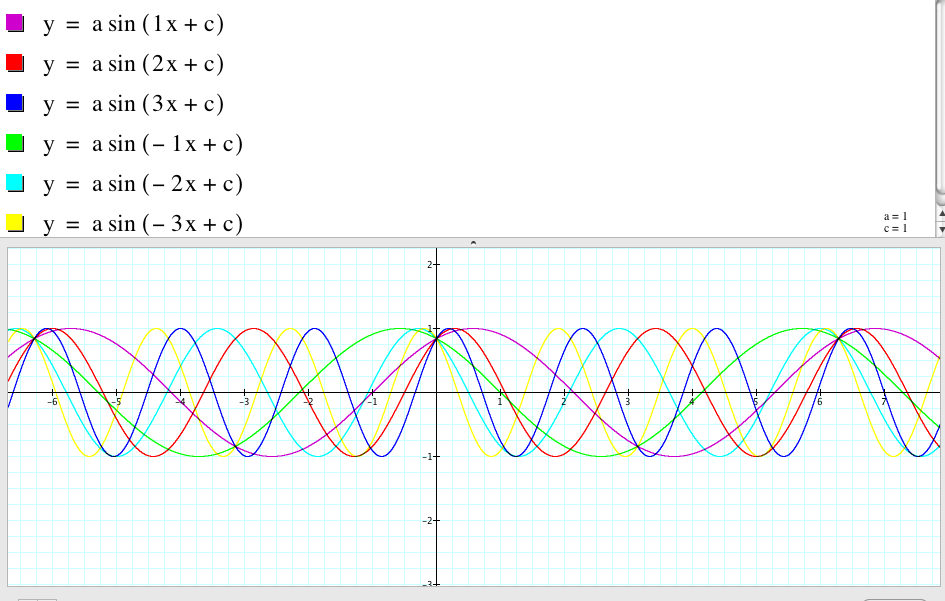
I changed the value of b with -3 to 3 and at the end I animate it. This b represents angular frequency (also referred to by the terms angular speed, radial frequency, circular frequency, and radian frequency) and it is a scalar measure of rotation rate. As the b goes to positively bigger and bigger, then the frequency is often more and more and vice versa for the negative b.
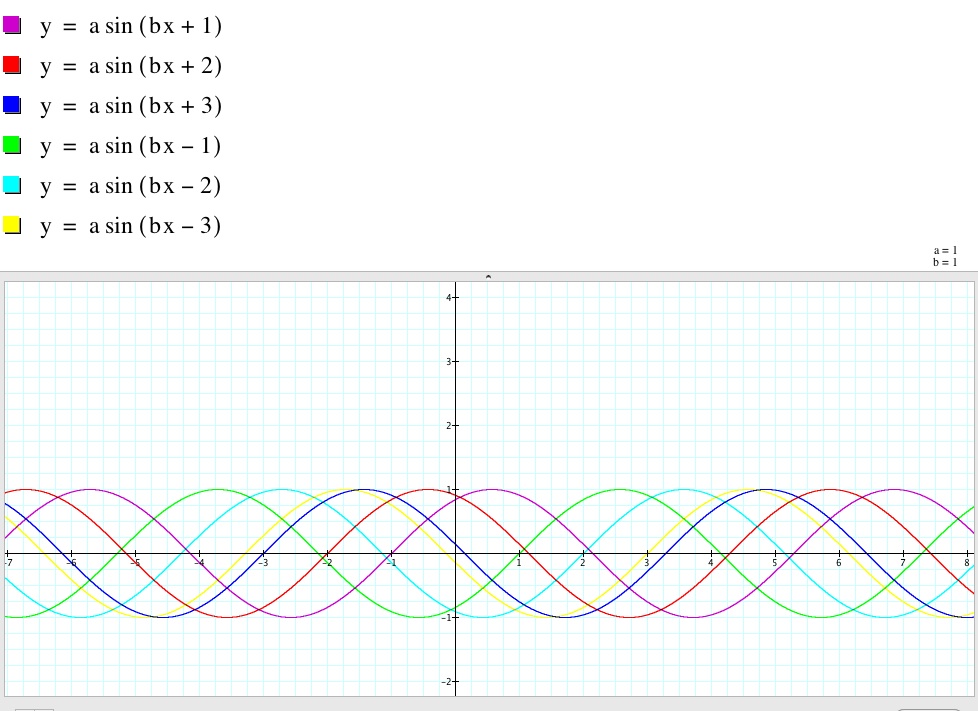
I first put positive integers for c, then the graph shifted to the left and for the negative values it shifted to the right. The phase of an oscillation or wave is the fraction of a complete cycle corresponding to an offset in the displacement from a specified reference point at time t = 0. Phase is a frequency domain or Fourier transform domain concept, and as such, can be readily understood in terms of simple harmonic motion. The same concept applies to wave motion, viewed either at a point in space over an interval of time or across an interval of space at a moment in time. Simple harmonic motion is a displacement that varies cyclically.